
From Exoplanets to Climate Change: Research @OHS
Have you ever heard of RR Lyrae Stars, the technology EXOTIC, or the Bergström-Boyce Model? Have you ever thought about predicting heat waves or the threshold for herd immunity to the SARS-CoV-2 virus? These topics were all discussed at Pixel Fest’s Research Colloquium. OHS has many accomplished students, and those presenting at the Colloquium were no exception. While their confidence and presentation skills left the audience in awe, their projects were definitely the stars of the show. Each and every presentation had an in-depth, step-by-step explanation covering some of the most eminent research topics of the era. It was a striking end to the series of Research Colloquiums we’ve had this year! Past topics have included Machine Learning, Math Research, Tea, and Astronomy.
OHS Students Participate in NASA’s Exoplanet Watch Program:
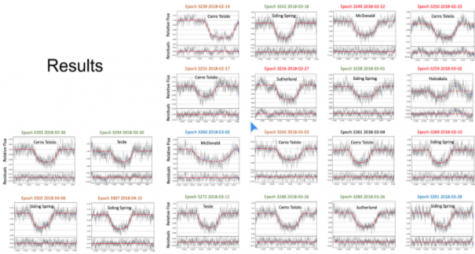
The first presentation on the docket was “Ephemeris Update of WASP-43 b Using EXOTIC” presented by Eli-Geandru Distler, Elliot Chalcraft, Milla Ivanova, and Timothy Felton, which delved into the research of exoplanets, or planets that orbit stars outside of this solar system. The OHS team’s research was part of NASA’s exoplanet watch program, a “citizen science project” to “observe transiting exoplanets” with smaller telescopes. The team examined the transits of WASP-43b, a planet discovered in 2011 about 260 light years from Earth. Since exoplanets do not give off light, the only way to track or study them is by examining the decrease in the amount of light their host stars give when the planet passes in front of the star, also known as a transition. The OHS team was backed by Ms. Kalée Tock, a science instructor at OHS and astronomy enthusiast. The team worked with Las Cumbres Observatory, hosted across multiple geographical areas around the world, to look at telescope images and measure starlight. Using EXOTIC technology, they analyzed these images and made the curves in graphs below. Of the 31 images presented by the Observatory, they were able to produce 20 graphs of transits from different locations all over the planet! By checking the observed transit times against the ones calculated by NASA scientists, they determined that the NASA estimates were off and presented their findings of the Ephemeris Update. Eli-Geandru Distler, a team member, recalls that her favorite experience throughout the project was seeing how her team was “able to make a difference” and had the honor to “help NASA” with a project that is a once-in-a-lifetime opportunity.
OHS Students investigate the Properties of Star Clusters:
Another thought-provoking project presented in the Colloquium was research for “RR Lyrae Variable Star Analysis”, conducted by Micheal Fitzgerald, Kalee Tock, Elias Koubaa, Pat Boyce, and William Lee. Living in a city, Elias Koubaa, was never able to see the stars properly due to light pollution. He became fascinated with astronomy when he looked up at the thousands of stars in the night sky in a darker environment. This project investigated a globular cluster of stars, known as M92. The only way to find certain properties, such as metallicity and distance, of a globular cluster is to look at the RR Lyrae stars, stars commonly in the red giant stage, in said cluster. The team used concepts such as the instability strip, a region of a H-R diagram. This diagram plots the temperature or stars against their luminosity, “occupied by several classes of pulsating stars”, and keeps the period-luminosity relationship in mind. The “period-luminosity” relationship, which relates period to to average luminosity, is determined by fitting a trendline. The OHS team emphasized choosing the right exposure time as it can affect results. 300 second exposures were sufficient to image all the stars in the M92 cluster. Using the data, the OHS team was able to use Pysochrone to generate color magnitude diagrams based on a curve fit. They also used the data to create lightcurves, which are graphs that show the brightness of an object over time. They found 17 RR Lyrae stars in the M92 cluster and found that the cluster had a low metallicity. They estimate that the cluster is around 11 billion years old.
OHS Student Predicts Heat Waves Using Artificial Intelligence:
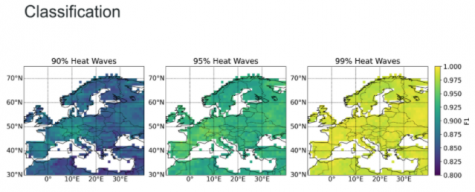
William Liu, another presenter at the Colloquium, presented his project “Comparison of machine learning methods to predict heat waves,” which masterfully combined natural and computer sciences. According to his research, unpredicted heat waves have horrible consequences including famine, drought, and death. Due to climate change, heat waves are expected to worsen. Heat waves also disproportionately affect the elderly and homeless. However, they are not unbeatable. If we are able to predict them, the government and news stations can warn people. The task William set out to accomplish was predicting the next heat wave given factors such as surface temperature, potential vorticity, and soil moisture. Using “Scikit learn” and Python, he attempted two different methods of solving the prediction problem. First, Lui attempted to use a regression to fit the data,but unfortunately, this did not reveal the accuracy that he wanted. Lui then switched to a classification method of random forest rather than a multilayer perceptron (neural network), and this method provided the highest accuracy. After training the model with current and historical data, Lui proceeded to remove the most recent 28 days of data in order to check if the accuracy would remain the same. The model produced the same high accuracy of almost 85%. Liu was surprised by how flexible the classification models were and the accuracy and the usefulness of the random forest method.
OHS Student Finds Trends in COVID-19 Data:
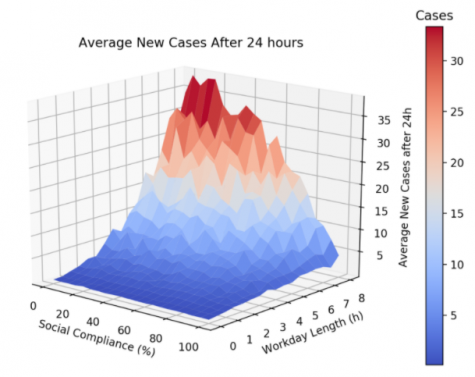
Gurmehar Singh, worked to look for insights in the COVID-19 pandemic data by simulating the virus with his project “Modeling SARS-CoV-2 with Stochastic Simulations.” Stochastic, a word commonly used by biologists and computer scientists alike, means random. Singh states that the process of “computational modeling of disease” is not a “new” process. Singh aimed simply to find hidden phenomena in the data, focusing on prevention and stopping the spread. According to Singh, there are three steps to creating a reliable and effective simulation: Mechanics, such as tracking infection, movement of people, and recovery; Cross-checks with CDC statements and prior knowledge; and finally creating Realistic Scenarios by arranging people, tracking meaningful units, and giving people daily cycles (routines). Singh’s realistic simulation included setting people up at “home” and “work”, creating commute cycles, deciding the amount of time people spent at work and how much people will randomly move. He also assigned meaningful variables such as workday length, social compliance, and location. He ran his simulation thousands of times using Matplotlib and Python and collected vast amounts of data to create the graph below. According to his results, as long as 60% of social compliance was completed the number of cases dropped drastically. This has huge practical implications as far as herd immunity and general predicting real word spikes in cases can go! Singh’s GitHub Repository: (https://github.com/gsingh-0-0-1/covid-simulations)
OHS Student Predicts Effects of Climate Change on Plant Cells:
The final presentation of the Colloquium was Damian Musk’s “Applying the Bergström-Boyce Model to Cell Wall Biopolymers with Qinghai-Tibetan Plateau Climate Data.” Musk believes that climate change is an ineffably significant issue, with much research on the topic being purely experimental. For this reason, Musk chose to build a computational model to answer the following research question: “How do cell wall materials deform under climate change, and what are the biological applications?” Musk’s first step was to identify a region for climate analysis, eventually settling on the Qinghai-Tibetan Plateau due to its extensive permafrost and scientific history. Next, Musk needed to identify a model upon which to base his computational model. He chose the Bergström-Boyce Model, which divides deformation into two parts: viscous deformation, which results in a linear strain under stress, and elastic deformation, wherein materials return to their initial state immediately after the stressor is removed. The model ultimately boils down to four differential equations: one for viscous stress, one for elastic stress, one for the deformation gradient, and one for viscous flow rate. Third, Musk needed to modify the model to include temperature. He did this using a shift function known as the William-Landel-Ferry (WLF) equation. Fourth, he analysed the materials from which the above properties could be obtained. He used a Python simulation to understand the effects of global warming on cell wall integrity. He saw some negative changes in xylan (a factor for measuring cell wall integrity) and found visible and concerning cell wall integrity changes. He extrapolated his data to include a 50 degree Celsius increase in temperature and found that this could completely devastate the flora of the environment. Musk concluded that “further research into climatological material science” is much needed in order to “understand what is impacted most severely by global warming” and find ways in which “we can best combat it” to ensure that future generations can enjoy the beautiful world we live in. To delve in further to his research, Musk’s GitHub and Overleaf are linked here: (Overleaf, GitHub)
Advice from Dr. Vetter:
If you were inspired by any of these projects, Dr. Vetter, the organizer of the Colloquium and Biology Instructor, has some advice for you! Usually, the research Colloquium happens early in early September. Therefore, Dr. Vetter suggests using the summer to work on a project and have it in shape to quickly submit an application to participate. Vetter also suggests “taking advantage of science fairs” as they are “less formal” and are most useful for “presenting projects which are in their early stages.” This is because the research colloquium is for complete, finished projects. Dr. Vetter also explained that the projects presented in the colloquium do not have to fit a lot of requirements. The only requirement is that they have to be about science: following the scientific method. If the project is done with another organization, then it must be ok with that organization to present the project.
If you are nervous about participating, there is no need to be. To help you prepare, there are practice presentations before you present in front of a larger group and everyone is willing to listen to your quality research. Dr. Vetter also suggests going to the science fair for practice if you are nervous as it’s less stressful. Thank you to all of the Research Colloquium’s participants for presenting their amazing projects and good luck to anyone who wants to participate in the future!